SQL Queries for Analysis
1. Total Revenue, Total Cost, Total Profit, and Total Orders by Region and Item Type
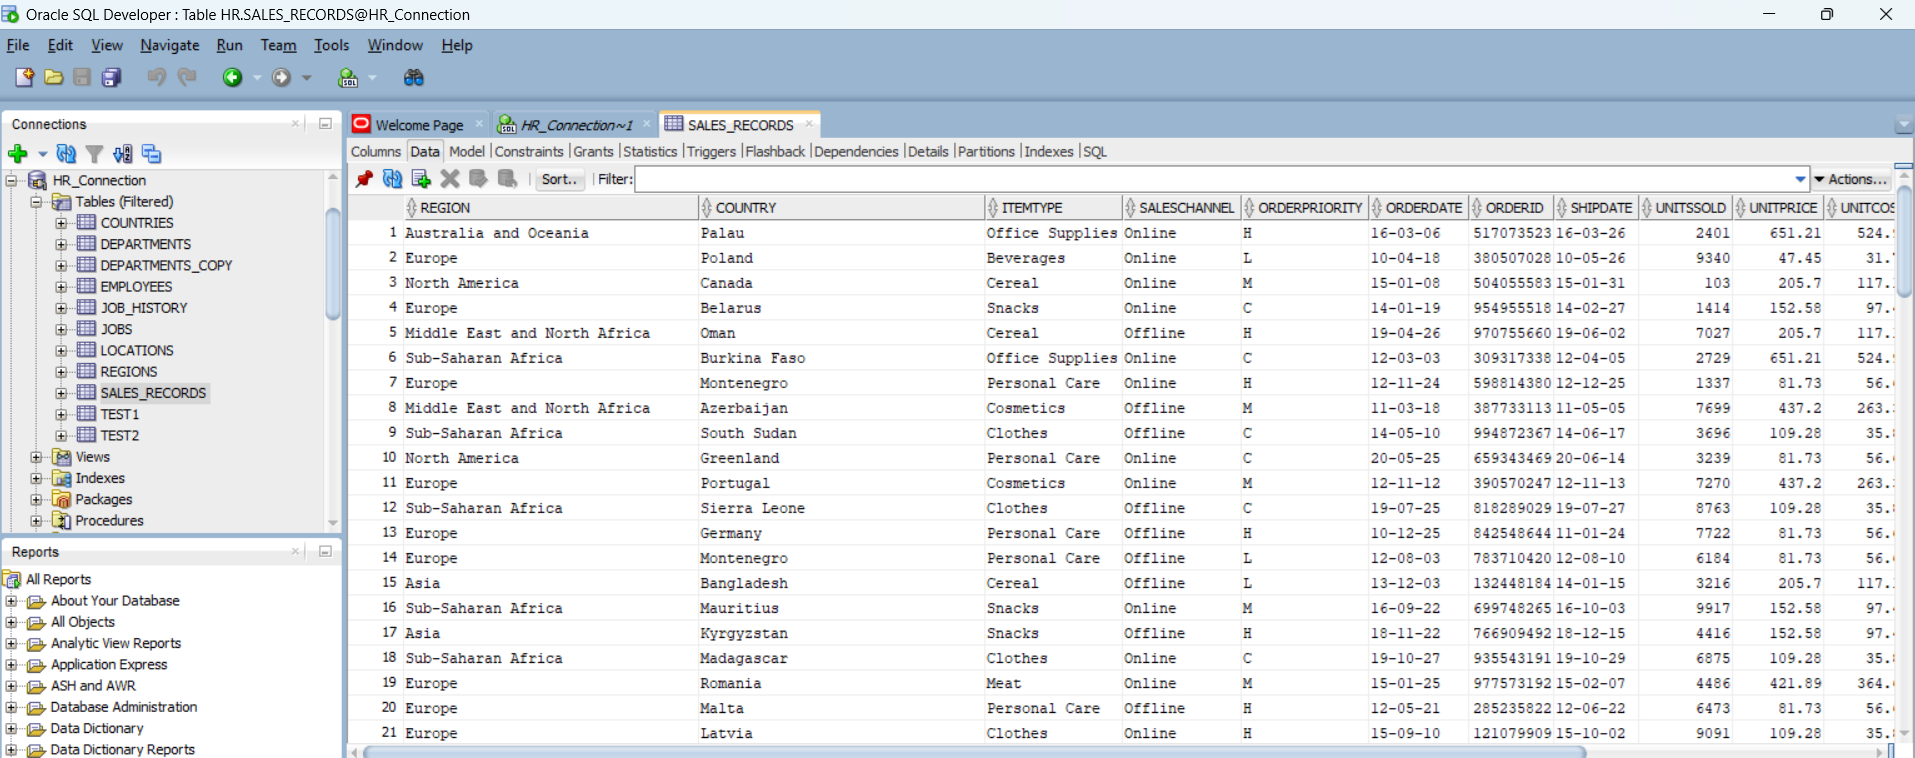
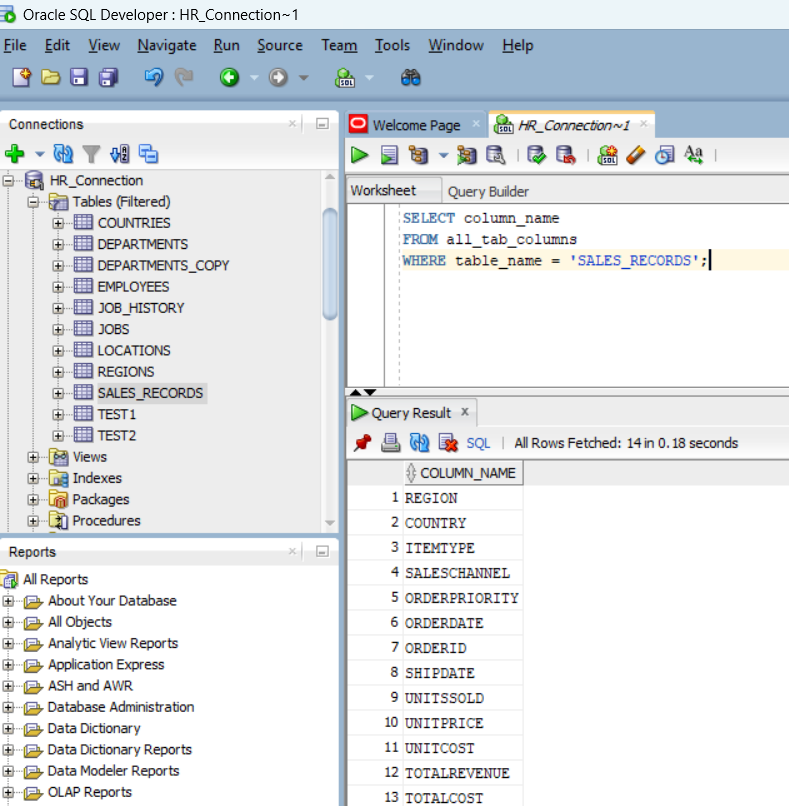
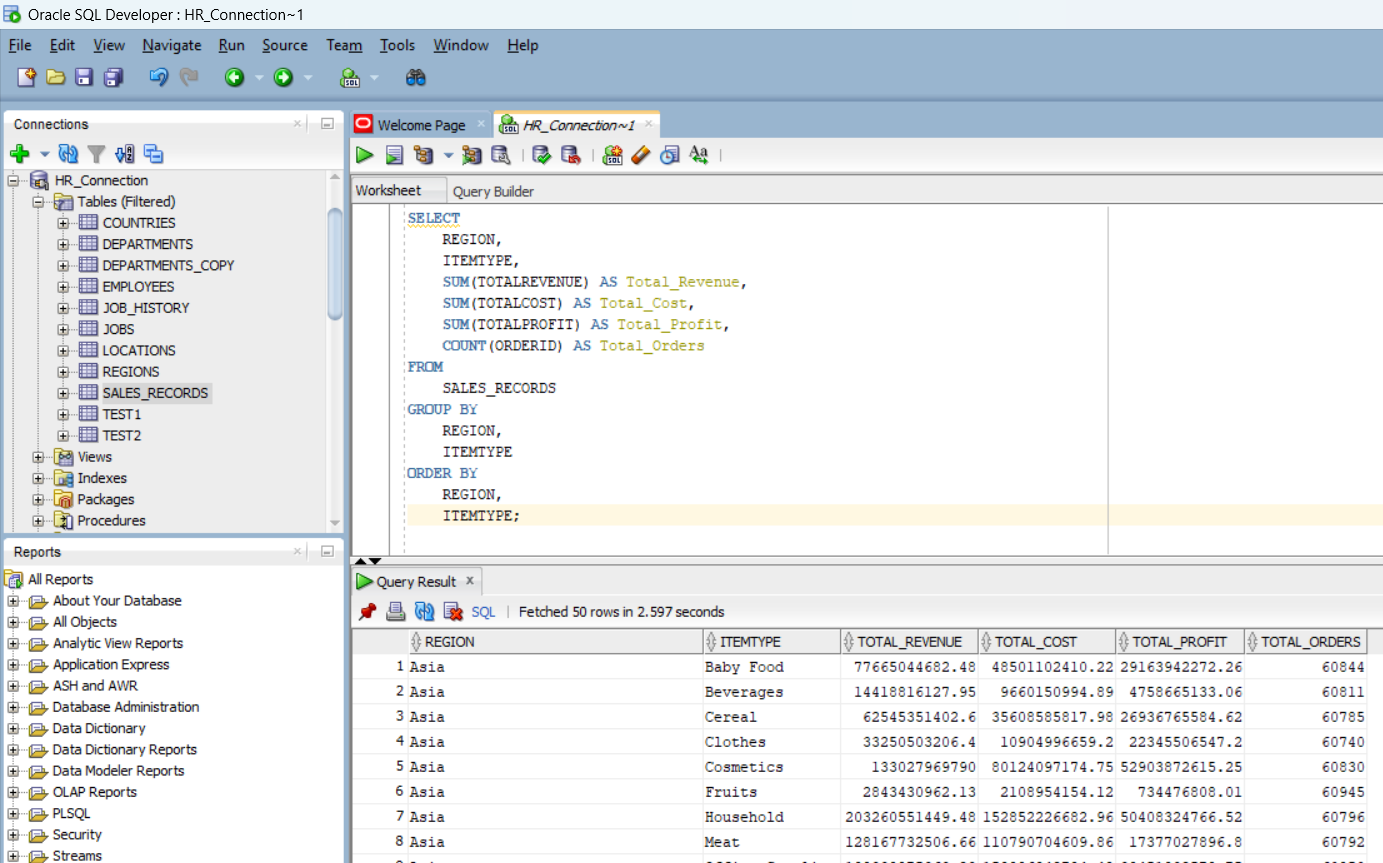
First, I tried to answer the question of how total revenue, total cost, total profit, and the number of orders varied by region and item type. To do this, I wrote the following SQL query:
            SELECT REGION, ITEMTYPE,
                   SUM(TOTALREVENUE) AS Total_Revenue,
                   SUM(TOTALCOST) AS Total_Cost,
                   SUM(TOTALPROFIT) AS Total_Profit,
                   COUNT(ORDERID) AS Total_Orders
            FROM SALES_RECORDS
            GROUP BY REGION, ITEMTYPE
            ORDER BY REGION, ITEMTYPE;
2. Count of Sales Records with More Than 100 Units Sold
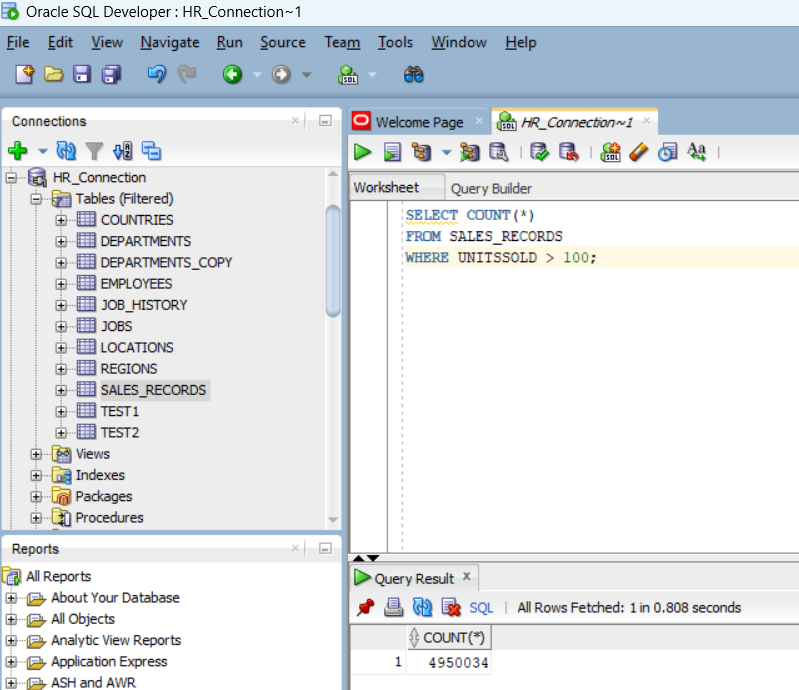
Then, I tried to answer the business question of how many sales records had more than 100 units sold. The SQL query I used was:
            SELECT COUNT(*)
            FROM SALES_RECORDS
            WHERE UNITSSOLD > 100;
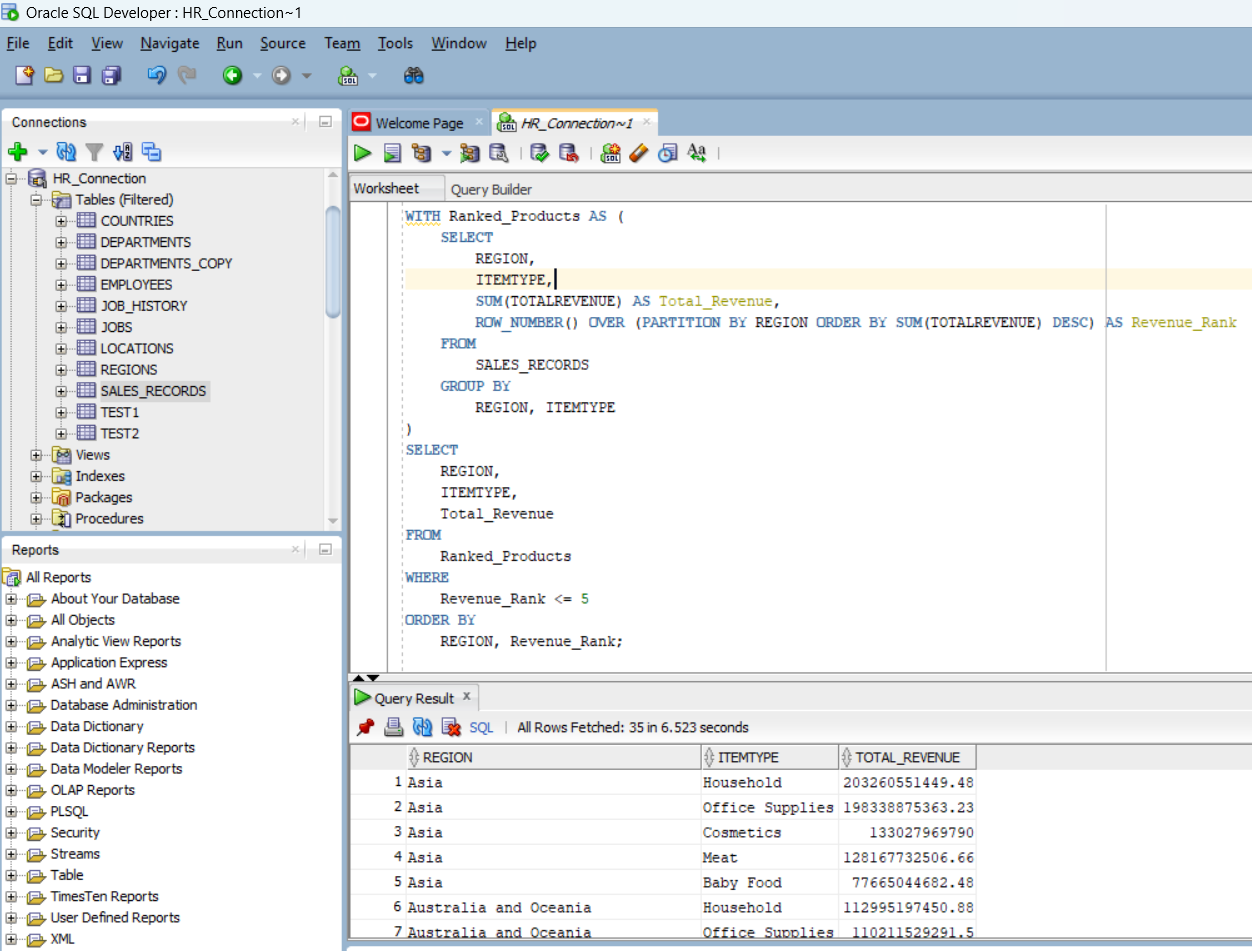
3. Top 5 Highest-Revenue Product Types by Region
For the top 5 highest-revenue product types in each region, I used the following SQL query:
            WITH Ranked_Products AS (
                SELECT REGION, ITEMTYPE,
                       SUM(TOTALREVENUE) AS Total_Revenue,
                       ROW_NUMBER() OVER (PARTITION BY REGION ORDER BY SUM(TOTALREVENUE) DESC) AS Revenue_Rank
                FROM SALES_RECORDS
                GROUP BY REGION, ITEMTYPE
            )
            SELECT REGION, ITEMTYPE, Total_Revenue
            FROM Ranked_Products
            WHERE Revenue_Rank <= 5
            ORDER BY REGION, Revenue_Rank;
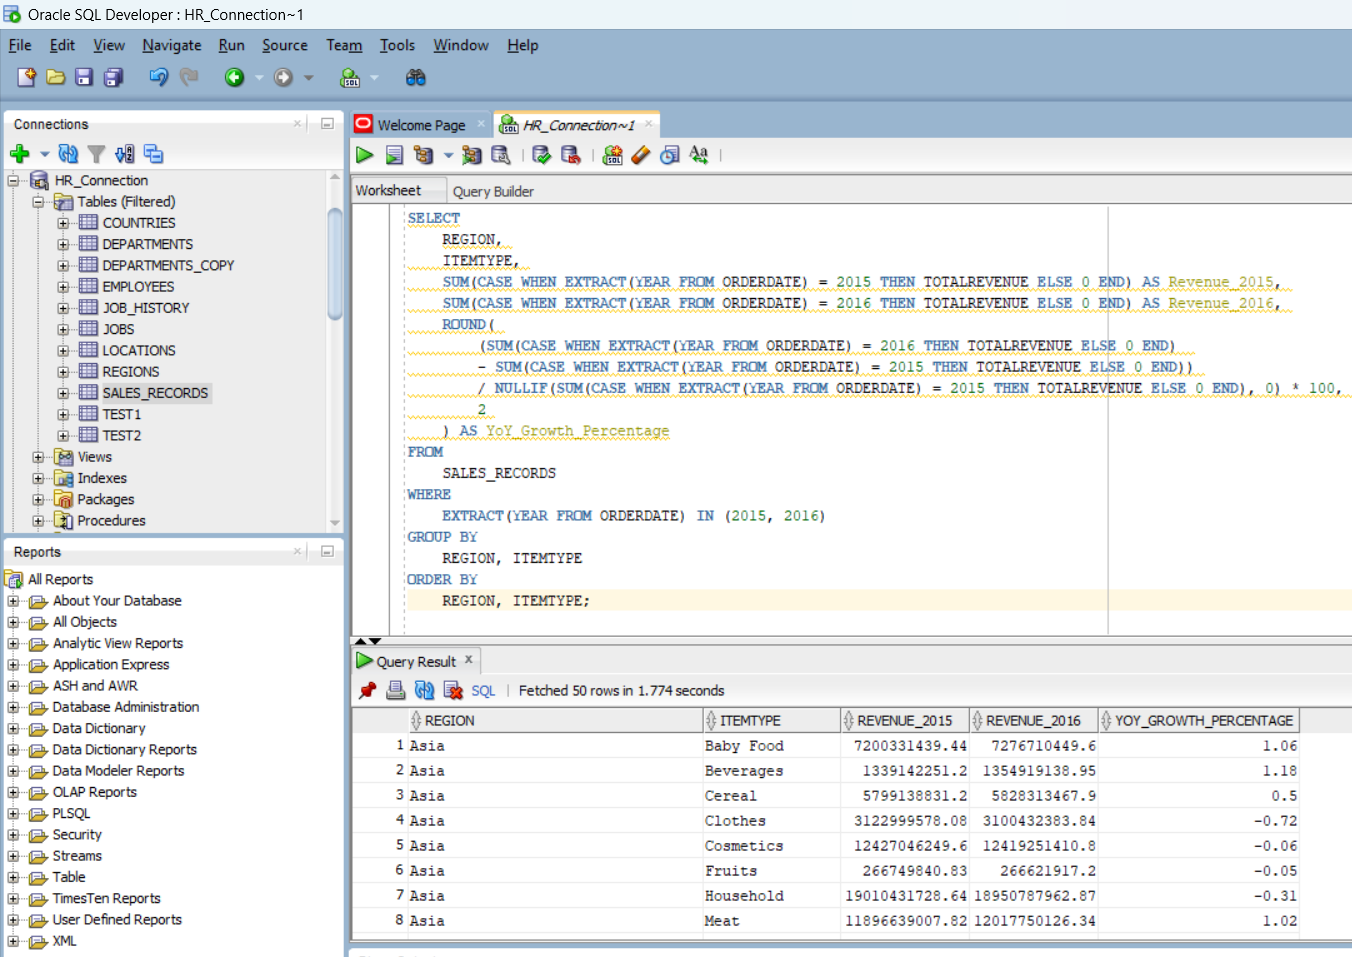
4. Year-over-Year (YoY) Growth in Revenue
To calculate the YoY growth in total revenue for each product type and region between 2015 and 2016, I wrote this query:
            SELECT REGION, ITEMTYPE,
                   SUM(CASE WHEN YEAR = 2015 THEN TOTALREVENUE ELSE 0 END) AS Revenue_2015,
                   SUM(CASE WHEN YEAR = 2016 THEN TOTALREVENUE ELSE 0 END) AS Revenue_2016,
                   (SUM(CASE WHEN YEAR = 2016 THEN TOTALREVENUE ELSE 0 END) -
                    SUM(CASE WHEN YEAR = 2015 THEN TOTALREVENUE ELSE 0 END)) /
                   SUM(CASE WHEN YEAR = 2015 THEN TOTALREVENUE ELSE 0 END) * 100 AS YoY_Growth
            FROM SALES_RECORDS
            WHERE YEAR IN (2015, 2016)
            GROUP BY REGION, ITEMTYPE;