SQL Solutions for Business Problems
I was working with data from the SalesLT schema in a database, and my goal was to answer specific business questions using SQL queries. Each query helped me answer a specific business question, whether it was about customer addresses, best-selling products, or the value distribution of orders.
First, I needed to understand what tables were available in the SalesLT schema. To do this, I wrote a query to list all the tables in that schema. This gave me an overview of the data structure I could work with.
SELECT *
FROM INFORMATION_SCHEMA.TABLES
WHERE TABLE_SCHEMA = 'SalesLT';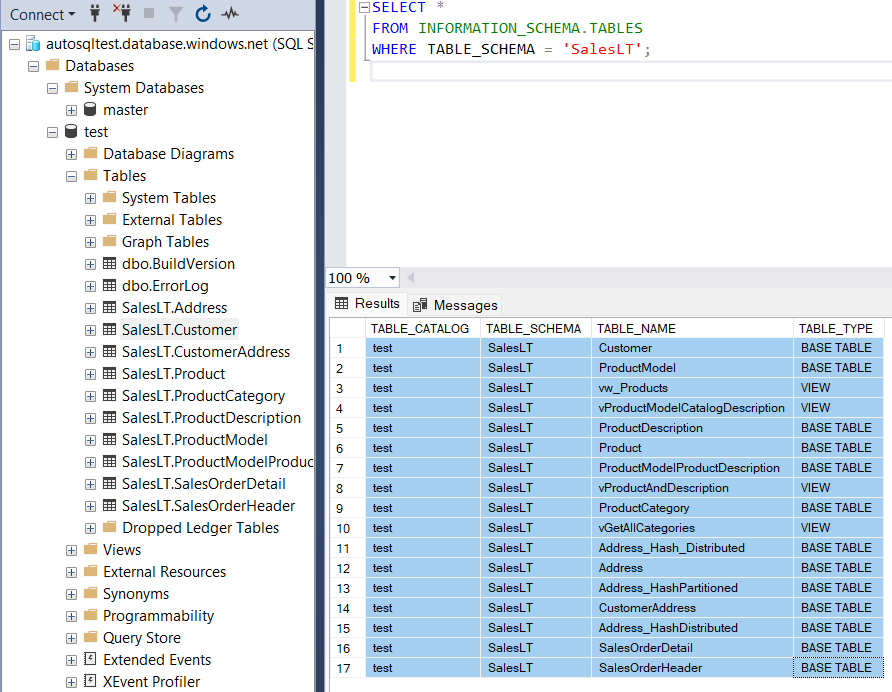
Next, I needed to explore how customers were linked to their addresses and whether the addresses included labels like "Main Office" or "Shipping." For that, I looked at the CustomerAddress table.
SELECT TOP 10 *
FROM SalesLT.CustomerAddress;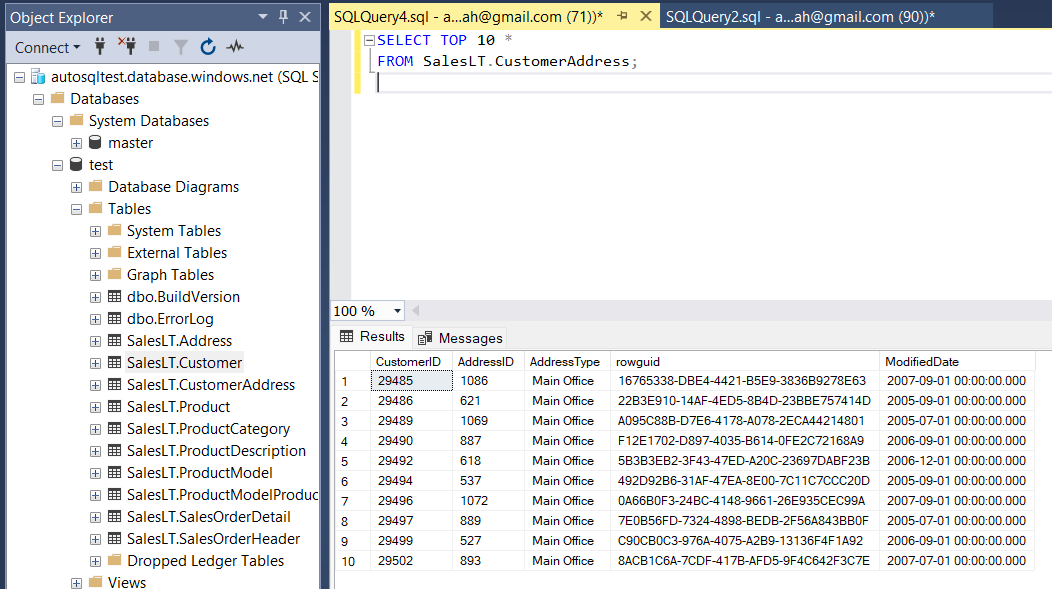
I wanted to find customers who had a "Main Office" address in Dallas and see if they also had a "Shipping" address. I needed to join several tables to pull this data together.
SELECT
    c.CustomerID,
    -- Main Office Address
    ma.AddressLine1 AS MainOfficeAddressLine1,
    -- Shipping Address (if exists)
    sa.AddressLine1 AS ShippingAddressLine1
FROM
    SalesLT.Customer c
-- Join the CustomerAddress table to get the Main Office address
LEFT JOIN
    SalesLT.CustomerAddress ca_ma ON c.CustomerID = ca_ma.CustomerID
    AND ca_ma.AddressType = 'Main Office'
-- Join the Address table to get the Main Office address details
LEFT JOIN
    SalesLT.Address ma ON ca_ma.AddressID = ma.AddressID
-- Join the CustomerAddress table again to get the Shipping address
LEFT JOIN
    SalesLT.CustomerAddress ca_sa ON c.CustomerID = ca_sa.CustomerID
    AND ca_sa.AddressType = 'Shipping'
-- Join the Address table to get the Shipping address details
LEFT JOIN
    SalesLT.Address sa ON ca_sa.AddressID = sa.AddressID
-- Filter to only include customers whose Main Office is in Dallas
WHERE
    ma.City = 'Dallas'
ORDER BY
    c.CustomerID;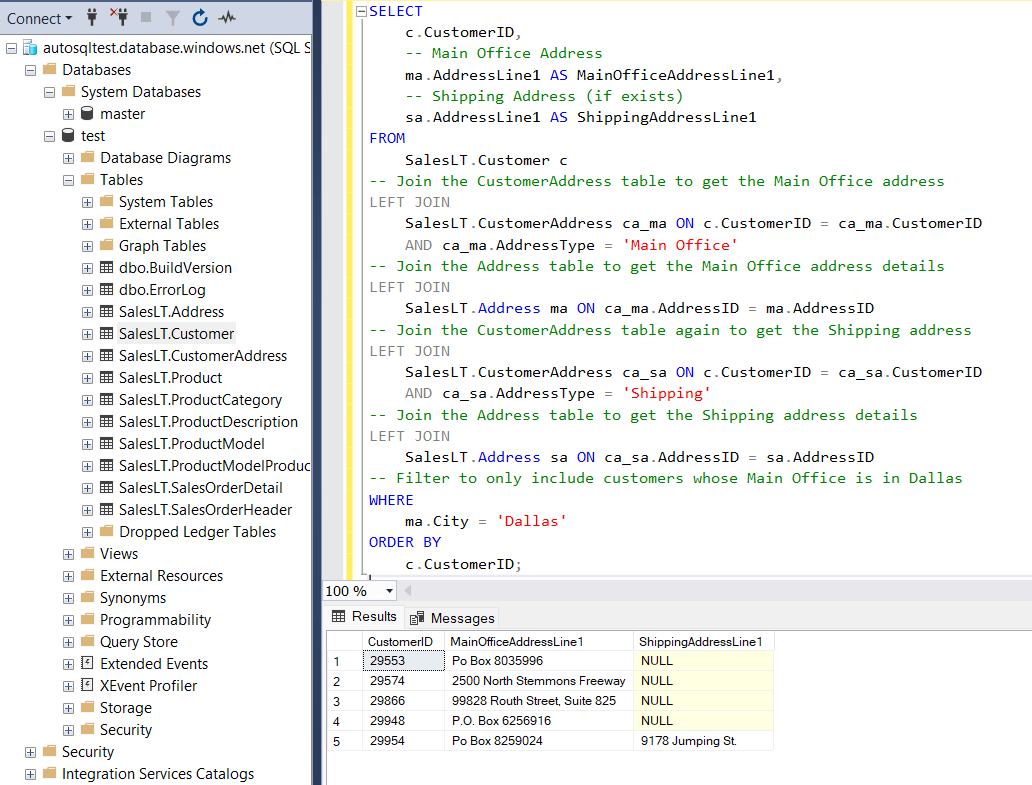
To find the best-selling product by total sales value, I needed to sum the sales for each product and sort the results. This would show me which product brought in the most revenue.
SELECT TOP 1
    p.ProductID,
    p.Name AS ProductName,
    SUM(soi.OrderQty * soi.UnitPrice) AS TotalSalesValue
FROM
    SalesLT.SalesOrderDetail soi
JOIN
    SalesLT.Product p ON soi.ProductID = p.ProductID
GROUP BY
    p.ProductID, p.Name
ORDER BY
    TotalSalesValue DESC;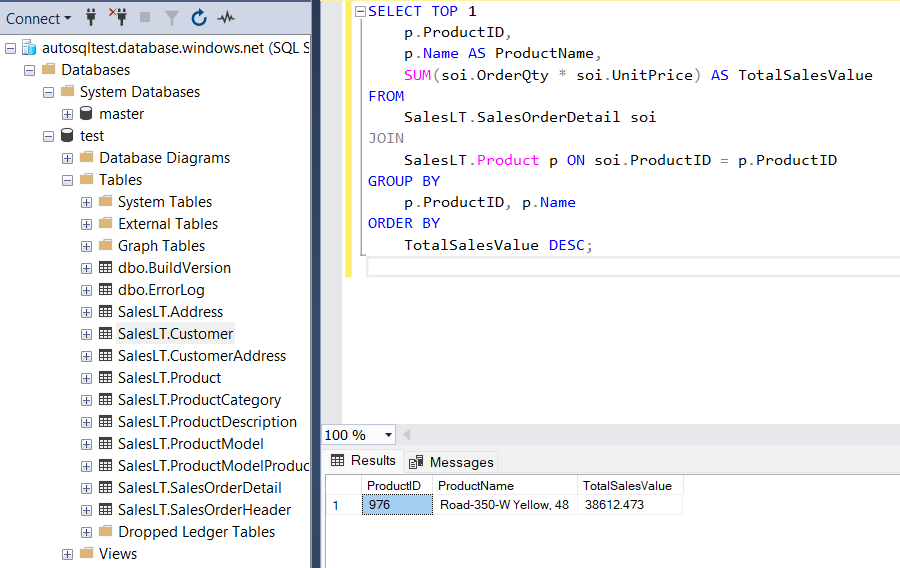
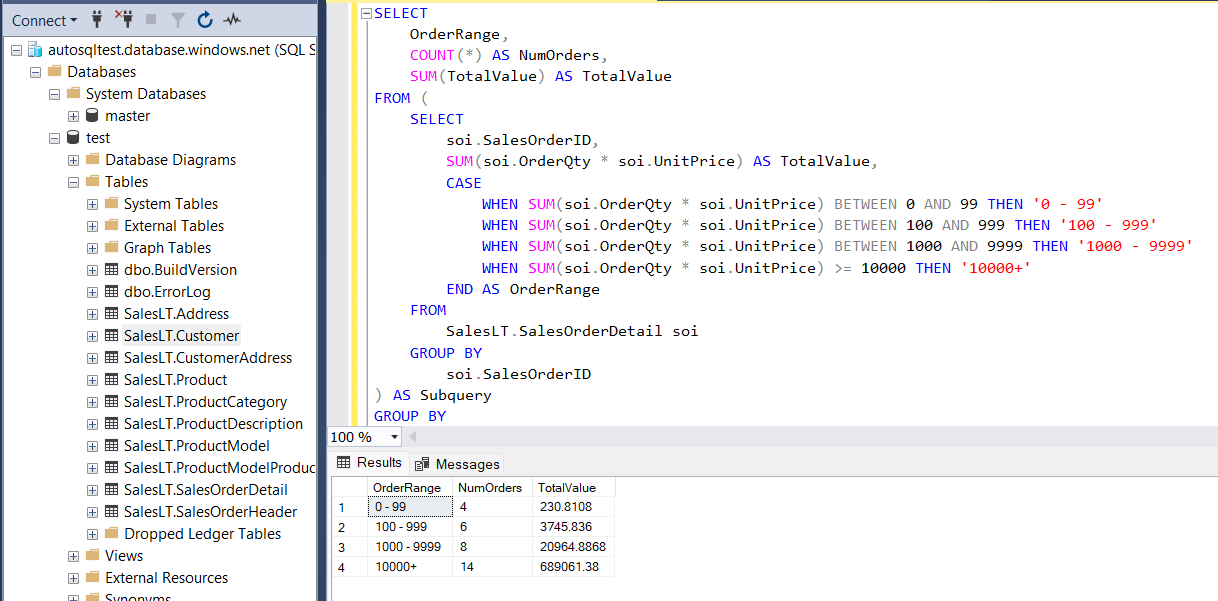
Finally, I wanted to group orders into different total value ranges: $0-99, $100-999, $1000-9999, and $10000+. This helped me understand the distribution of order sizes.
SELECT
    OrderRange,
    COUNT(*) AS NumOrders,
    SUM(TotalValue) AS TotalValue
FROM (
    SELECT
        soi.SalesOrderID,
        SUM(soi.OrderQty * soi.UnitPrice) AS TotalValue,
        CASE
            WHEN SUM(soi.OrderQty * soi.UnitPrice) BETWEEN 0 AND 99 THEN '0 - 99'
            WHEN SUM(soi.OrderQty * soi.UnitPrice) BETWEEN 100 AND 999 THEN '100 - 999'
            WHEN SUM(soi.OrderQty * soi.UnitPrice) BETWEEN 1000 AND 9999 THEN '1000 - 9999'
            WHEN SUM(soi.OrderQty * soi.UnitPrice) >= 10000 THEN '10000+'
        END AS OrderRange
    FROM
        SalesLT.SalesOrderDetail soi
    GROUP BY
        soi.SalesOrderID
) AS Subquery
GROUP BY
    OrderRange
ORDER BY
    CASE
        WHEN OrderRange = '0 - 99' THEN 1
        WHEN OrderRange = '100 - 999' THEN 2
        WHEN OrderRange = '1000 - 9999' THEN 3
        WHEN OrderRange = '10000+' THEN 4
    END;